
In my role at SpotHero, a lot of my time and focus is spent on optimizing the search experience. In an effort to increase new user conversion and retention, I worked alongside my Growth PM and engineers to run a series of experiments on the search experience throughout 2023. After an experiment ended, we would examine the data and use it to inform our next steps and next experiment. This agile approach to experimentation and innovation yielded great results on conversion and retention, and almost $8 million GMV.
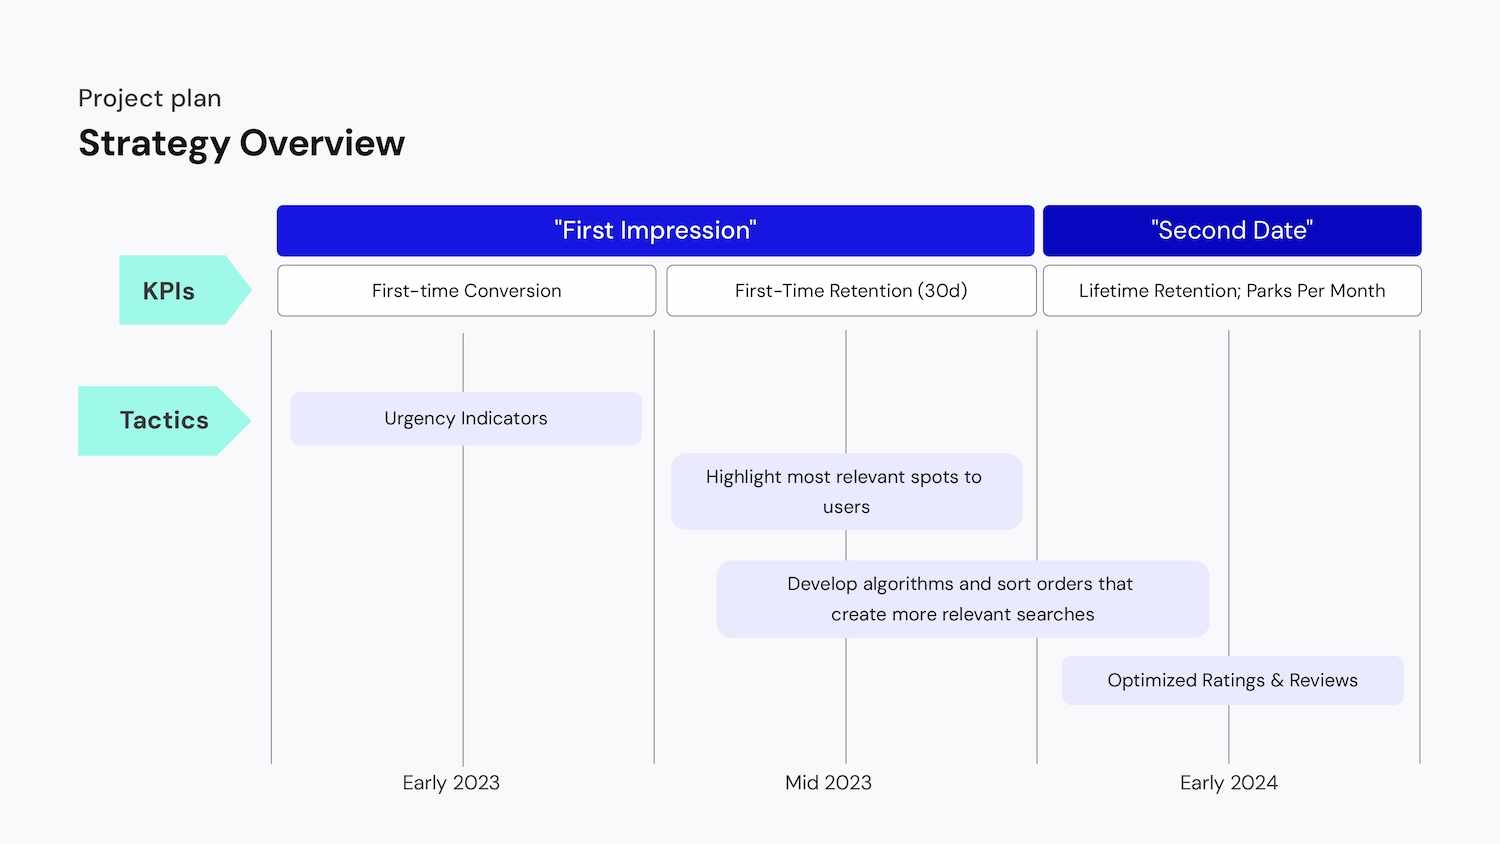
Our strategy involved 2 high-level phases: "first impression," which focuses on customer acquisition metrics such as first-time conversion and time to checkout. After positively impacting our acquisition metrics (and creating a better first impression), we would move towards impacting retention metrics such as short-term retention (making a second reservation within the first 30 days of their initial reservation), lifetime retention and parks per month.
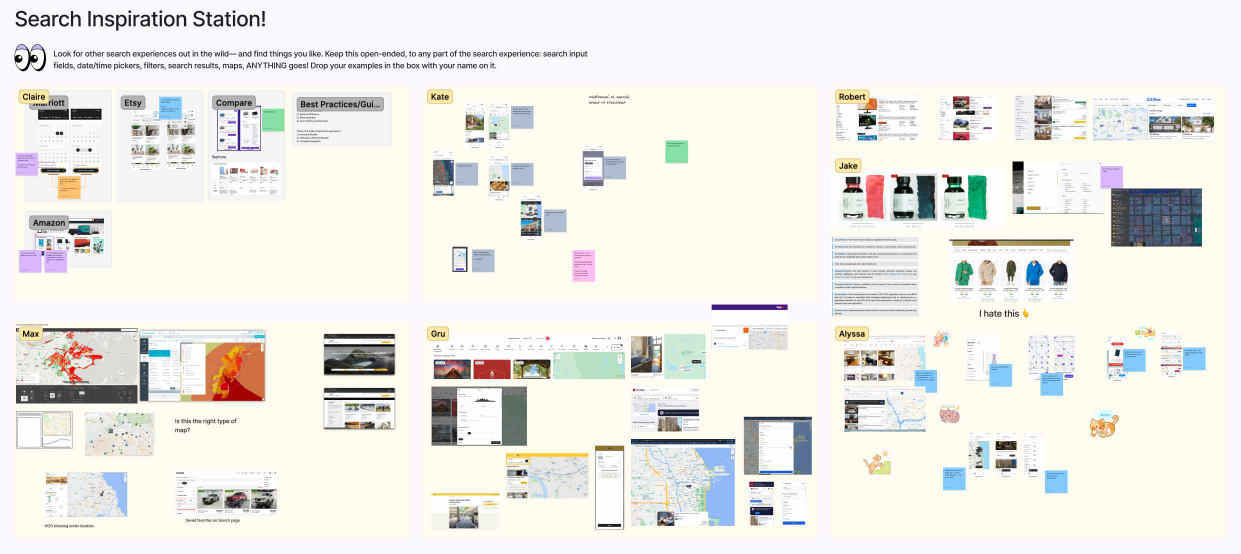
I had a brainstorming meeting with my squad that was focused on gathering inspiration from other search experiences. I gave everyone time to look for examples, and then drop screenshots of the examples on a FigJam board. We decided to experiment with some UI elements that other companies were using in their products: special tags, featured spots, and different sort orders.


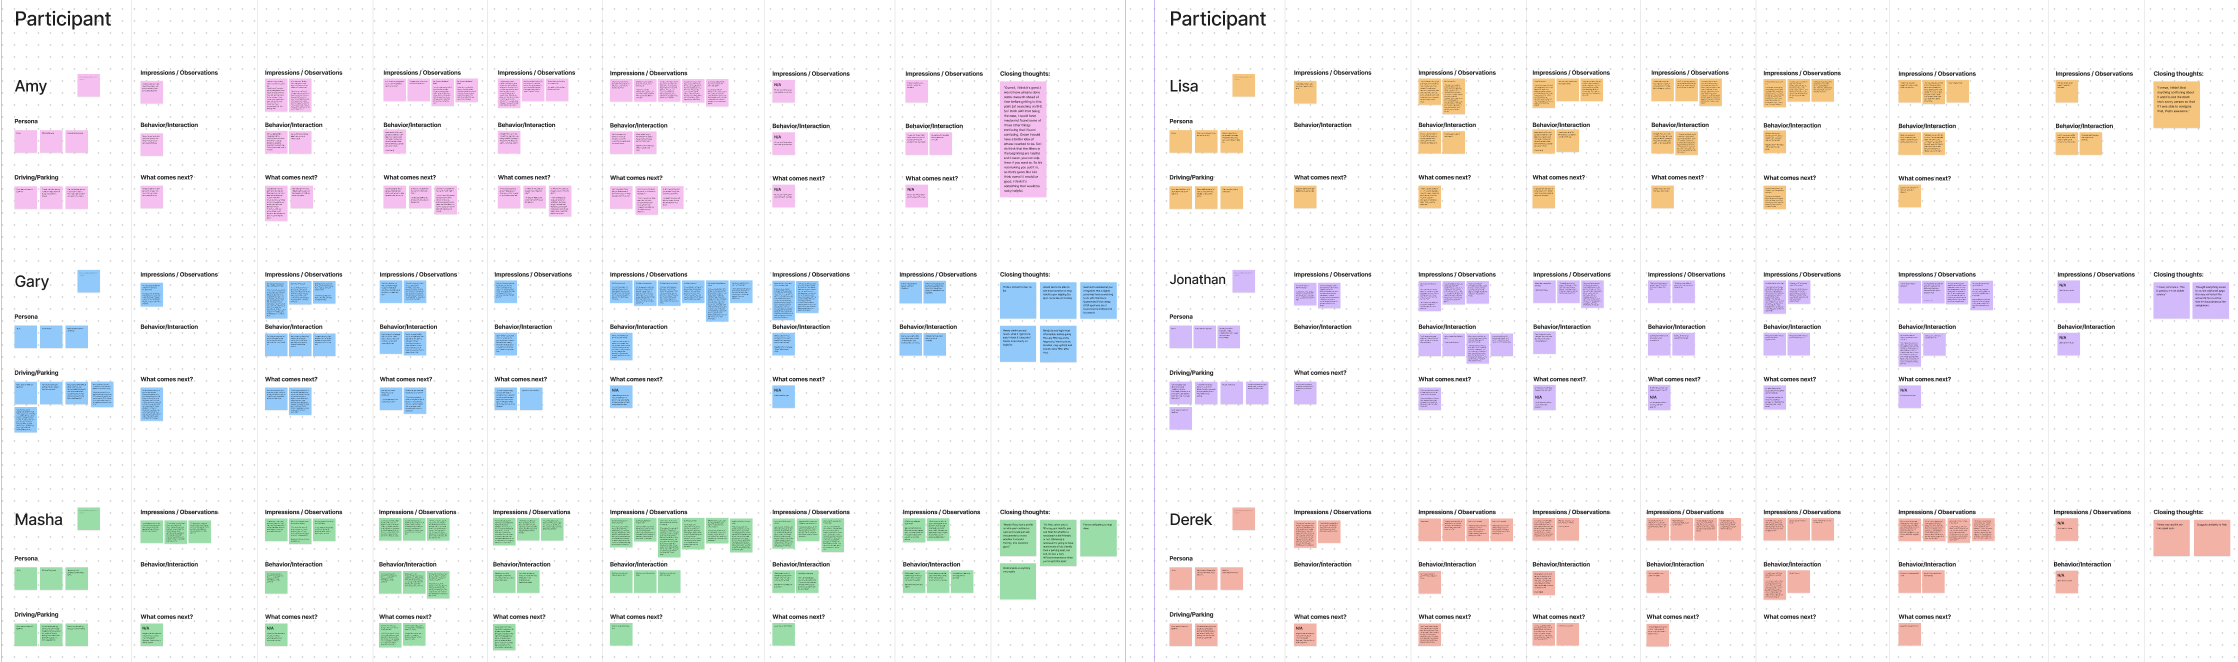
In the discovery phase of this project, I interviewed recent SpotHero users– a mix of frequent and infrequent users. The purpose of the interviews was to gather insights about existing problems with the search experience, and collect any feedback or suggestions for improvements from our users.

Basic "tell me about yourself" questions and questions about transportation habits and parking needs, wants and pain points.

Have the user talk about their driving habits and recent experience(s) booking with SpotHero; give the full context, tell the story like a scene.

Have the user screen share while they visit the SpotHero site in production and re-enact their recent booking experience. Notice any pain points.

Have the user go through a prototype of potential future concepts for the search experience and compare it to the live site– what do they like or dislike?
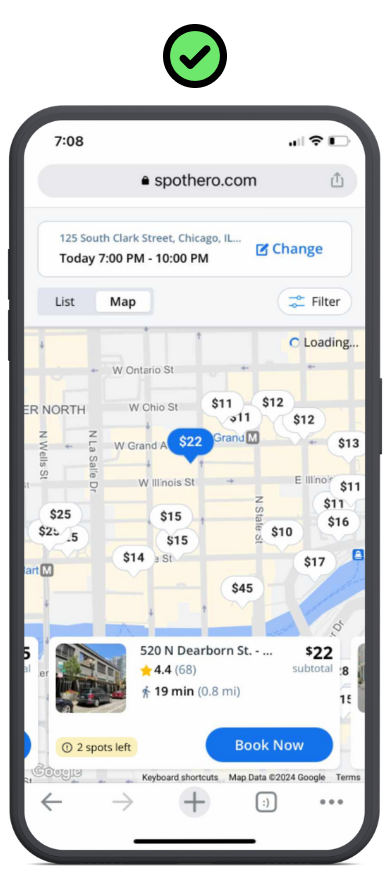
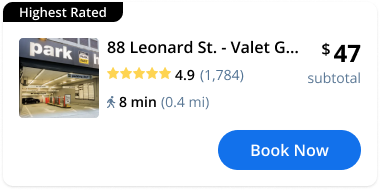
Knowing I wanted to begin experimenting with putting special callouts on spot cards and spot details, I started with 2 concepts that I saw repeatedly in my team's search for inspiration. Both concepts would help differentiate spots from one another, and both had an element of social proof, but I wanted to know which was more effective.
Calling out the number of remaining spots when a facility has 5 or fewer spots left. This communicates social proof– that people are using SpotHero enough to sell out– as well as a sense of urgency.
Calling out the amount of times a facility has been booked in a 24-hour period. This communicates popularity, as well as giving social proof to SpotHero, that people are using it a lot.
When showing prototypes of these 2 concepts to users, most understood the potential value of each one, but ultimately thought that Concept A would provide the most value and entice them to book.

We ran the initial experiment on Web platform for 2 weeks. We launched the experiment in Optimizely and tracked data there, as well as in Mixpanel. At the end of the experiment, when it was time to track more detailed analytics about shifting share and facility-specific data, we used Looker.
My Product Manager and I continuously tracked the data in the early days of the experiment to ensure that there was no harm done or obvious errors with the experiment. When we reached statistical significance, we were pleasantly surprised at how successful the experiment was. The following quarter, the tags were tested on native app platforms with similar results.
.png)
.png)
.png)
.png)
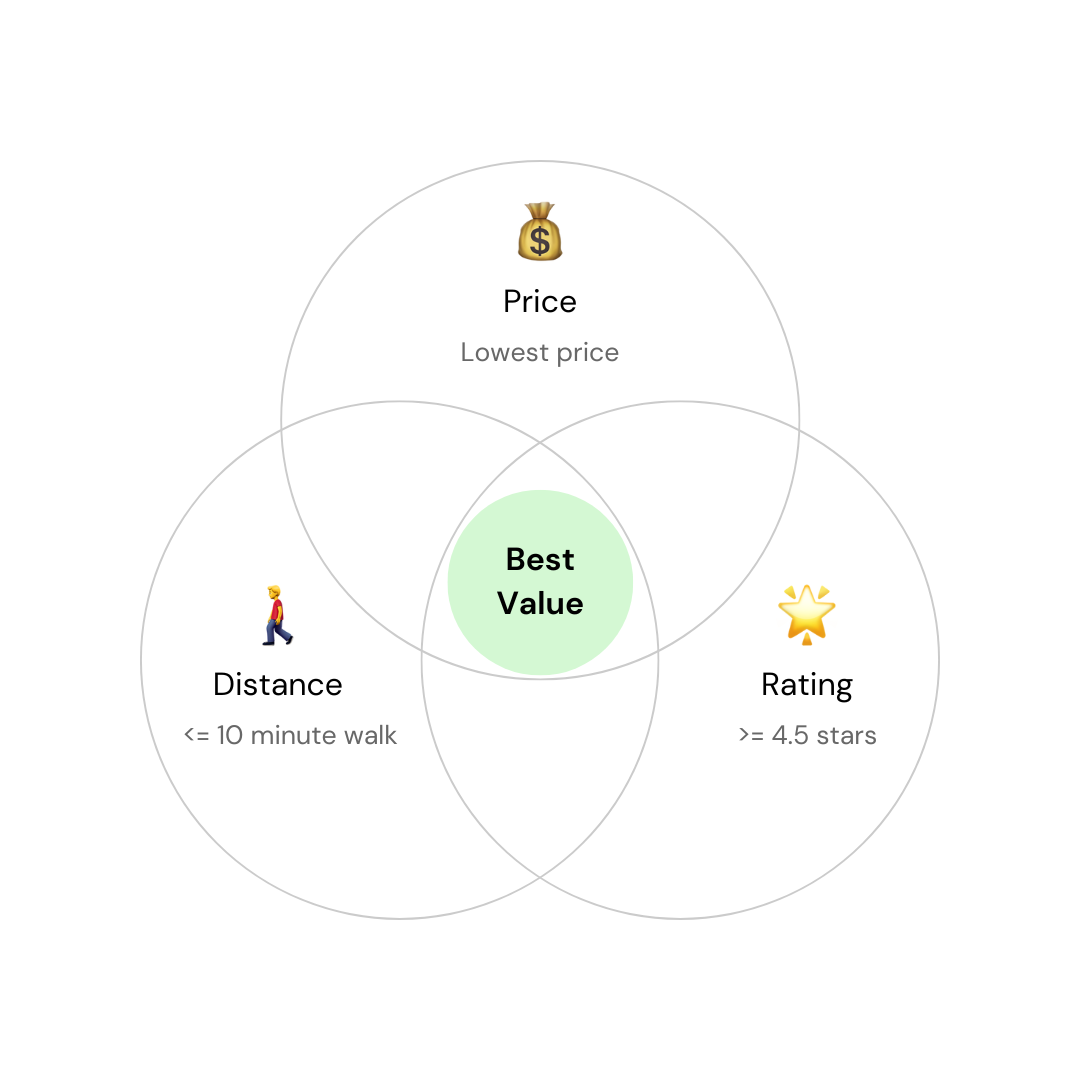
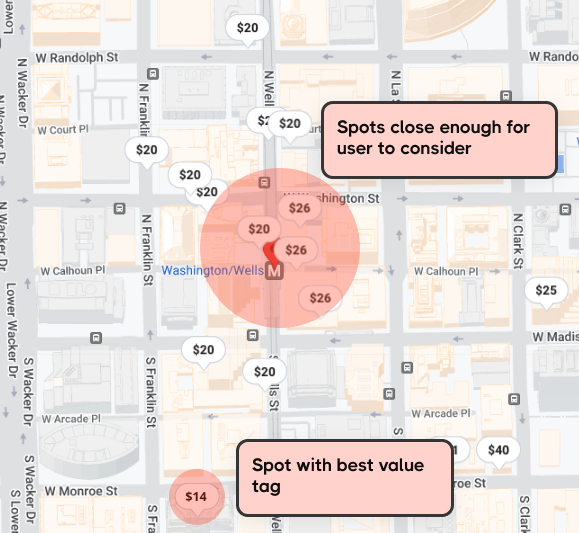
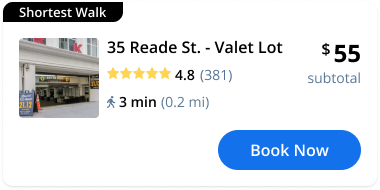
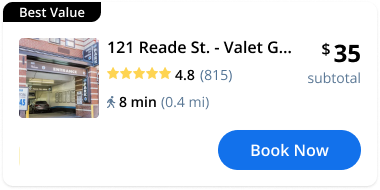
Our next idea for enticing user to make a conversion is to call out which spot in a set of search results was the "Best Value." In densely populated areas with ample inventory, search results can sometimes be overwhelming. We know from years of user research that users' main considerations are price and distance, so we came up with a formula that would feature the lowest-priced spot within a 15 minute walk in their search results.
The logic behind the dynamic tag is based on the criteria the users care most about when choosing a spot: price, distance, and rating.
This experiment initially ran as a 2-week A/B test on Web, with 50% of the audience seeing the Best Value tag and the other 50% being the control group. When the experiment hadn't reached statistical signifance at 2 weeks, we determined that there was no harm being done, so the test ran another 2 weeks.
.png)
.png)
We were surprised to see such minuscule differences in checkout rate in our test group, compared to our control group. The test failed to meet statistical significance; our metrics between groups were so similar that we could not determine whether the Best Value tags were helpful. We knew that the tags didn't cause harm, but they also didn't help conversion.
With the quantitative data being inconclusive, we wanted to gather some qualitative data to inform next steps. In an effort to determine why the Best Value tag didn't have an impact, I knew I wanted to do some usability testing and qualitative research to understand why and to inform next steps.

I wanted to gather qualitative data at scale to try and understand why we didn't see quantitative results with Best Value, so I ran an unmoderated usability test in UserZoom.
When having participants go through the SpotHero search experience in usability testing, we realized that they weren't looking at the Best Value spot because it was too far down in the search results. If the Best Value spot didn't appear within the first 4 results, users wouldn't notice it. This tracks with our historical customer data analytics, which state that over 80% of users choose a spot within the 4 closest search results.
The qualitative research helped shed some light on why the Best Value test didn't yield the results we had hoped for, and after analyzing the findings I had a good idea of what I wanted to test next.
Because the post-experiment research from the Best Value test suggested that the tagged spots were not relevant to the user, it was clear that some heavy lifting from Data Science and engineering was needed. The strategy here was to develop more robust algorithms and changing sort order to surface the most relevant search results to the user.
Short-term retention; long-tem retention.
Web (most new users): December 2023
iOS and Android (most repeat users): April 2024
The reason for the delay is because of the logic being moved to the back end, requiring Platform work.
.png)
If we change the sort order to "sort by relevance" and showcase spots that are low priced, highly rated, and close distance, we will:
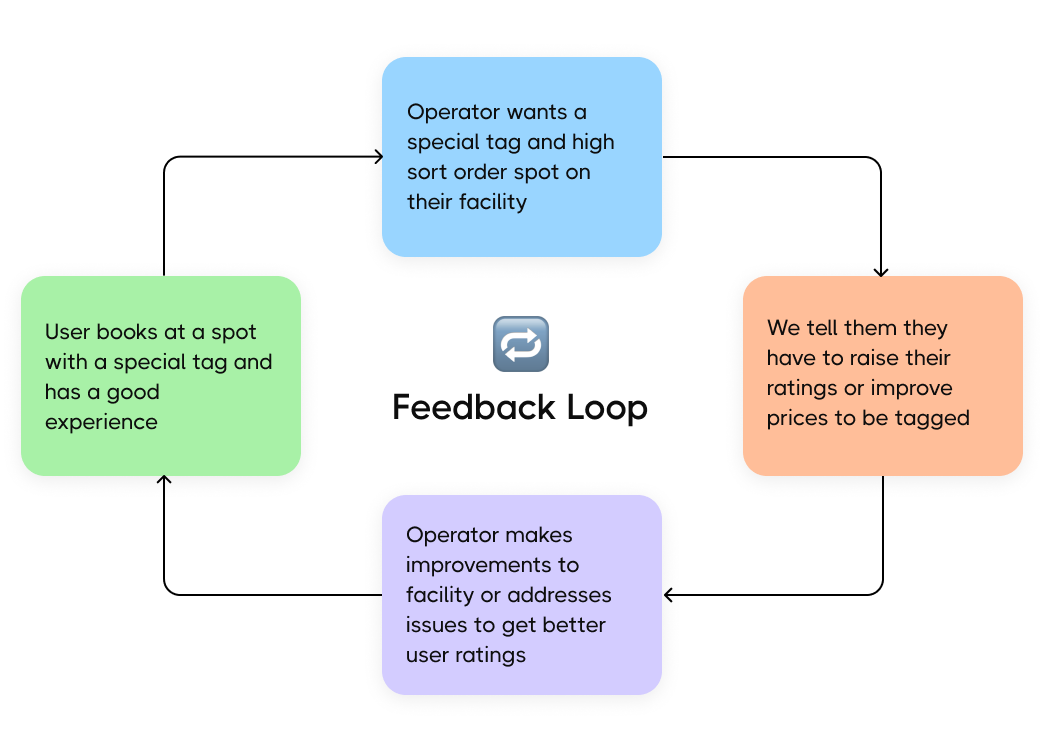
"Sort by Relevance" has already started a feedback loop on the other side of the SpotHero marketplace; our operators noticed the tags and are already working to improve issues at their facilities to earn better user ratings to stay competitive with other facilities in their microclimate so that they can appear high in search results.
We anticipate seeing a huge improvement in another company initiative, Quality Supply, because of this. The Quality Supply initiative is on the other side of the SpotHero marketplace: the operators league, who manage parking facilities. This initiative is focused around getting operators to address any issues with their facilities or pricing to ensure that SpotHero users are likely to have a positive experience and continue to use SpotHero.
Overall, this project gave me the incredible experience of collaborating with Data Science, analyzing data and implementing data-driven design decisions. In today's era of product design, I am well aware that having a thorough understanding of how to collect, analyze and leverage data is critically important. Being able to see such drastic increases in conversion in revenue from small tweaks in UI elements and search order logic left a powerful impression on me and has converted me into a true believer in leveraging data to make design decisions.