
In the first quarter of 2024, I served as the sole designer on a project focused on optimizing the Ratings and Reviews experience. The opportunity area stemmed from the feedback loop effect that emerged from the Sort by Relevance special tagging that we implemented during our search experiments the previous quarter.
Because historical foundational resarch has always informed us that users take a facility's ratings into consideration (behind distance and price), we held the assumption that if operators raise their facility's average rating, users would be more likely to book at their facility. In order for operators to best understand how to improve their facility's rating, we needed more detailed user input. We knew that by enabling SpotHero drivers to provide more detailed and specific feedback about their experience at a certain parking facility, it would benefit the operators by providing them more precise actionable suggestions for areas of improvement.

Improving our star ratings infrastructure and data will help us highlight & reward facilities that put effort towards a good customer experience, fostering feedback loops that drive up overall spot quality, increase user trust, and ultimately improve conversion & retention for both new & repeat drivers.
Product Management, Data Science and Finance estimate that hitting the OKRs set could result in an additional $2 million to $4 million incremental GOV per year.
We knew we needed to introduce more entry points into the rating experience and build out the capability for users to rate on web, but next we needed to dive into the post-MVP ideal state of the ratings capturing experience. Before being able to design a solution around how to quickly capture specific feedback, it was essential to get a thorough understanding around the criteria that users rate and review based on, and the key elements of both a negative and a positive experience. I was the sole researcher, and I executed several research methods to provide adequate insights to inform a user-centric design.
By utilizing multiple generative research methods, we had enough qualitative and quantitative data to see distinct patterns emerge. I had a clear understanding of the most common reasons behind a higher star rating vs. a negative star rating. I now had the information to inform around of data-driven designs to test with users.


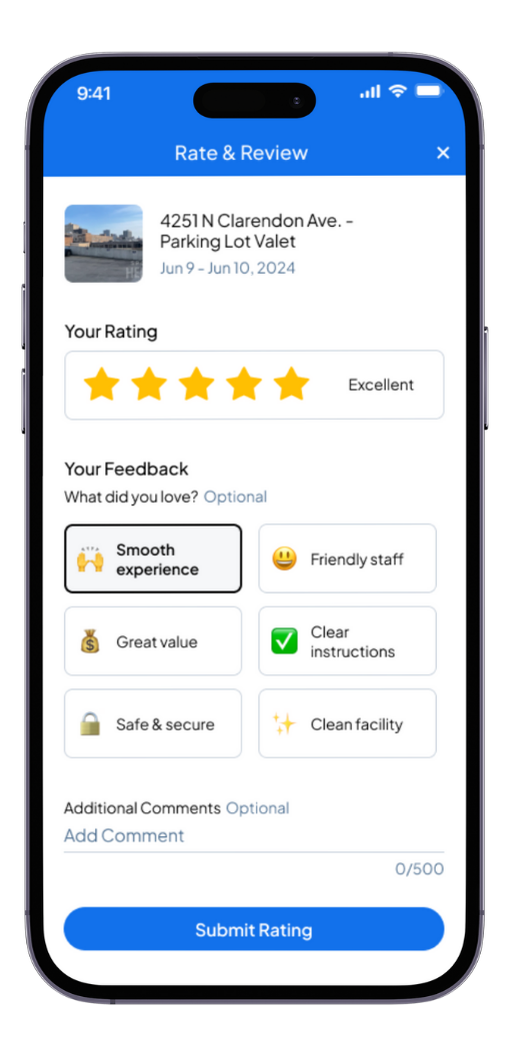
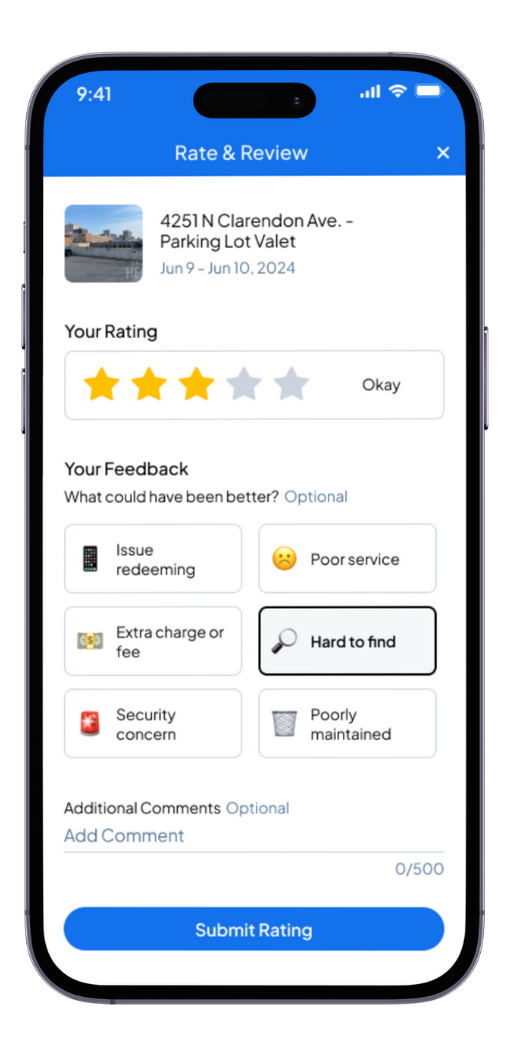
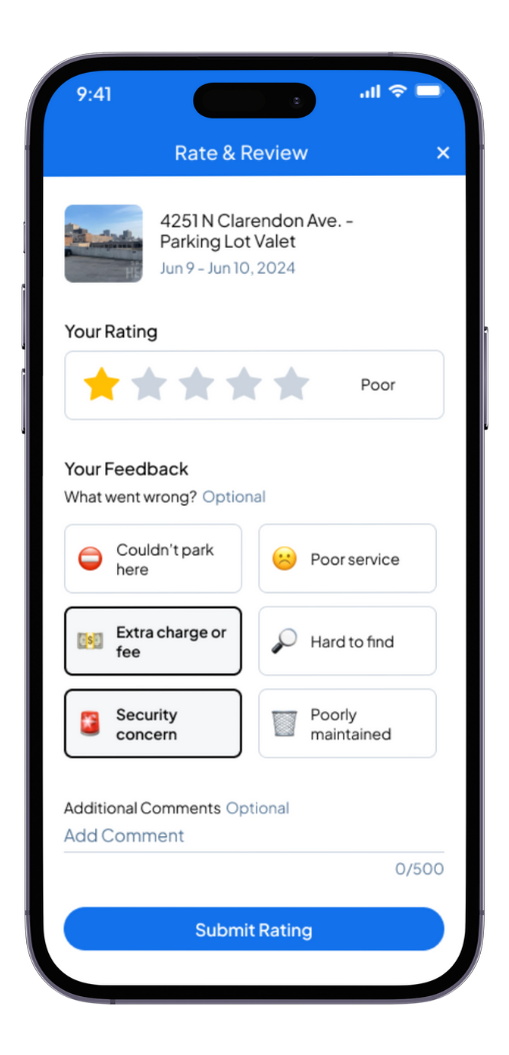
In a brainstorming session with my product team, I asked everyone to collect examples of inspiration for potential solutions that we could leverage for this project from other sites and apps. We found that a lot of other consumer-facing products were implementing a pattern containing pre-filled prompts for users to select to add more context to their star rating, but the ones we referenced most often were Sweetgreen, Uber Eats and Instacart. With the data we gathered from customers' written reviews, customer support contacts and survey results, I knew that our lists of commonly reported experience highs & lows would be well suited for this type of design pattern.
.png)
While I knew that the ideal state of ratings & reviews (post-MVP) would require quite a bit of research and discovery work, I devised a plan with my team's product manager, engineering manager and company leadership to knock out some quick wins to increase the amount of ratings we are able to collect across platforms. We had our engineers begin to add more entry points to the current rating experience, as well as build out a capability for web users to leave a rating.
By building out the capabilty to collect more ratings data across platforms before releasing the more robust quick-prompt iteration so that the data collected from the future iteration will be at a larger scale.

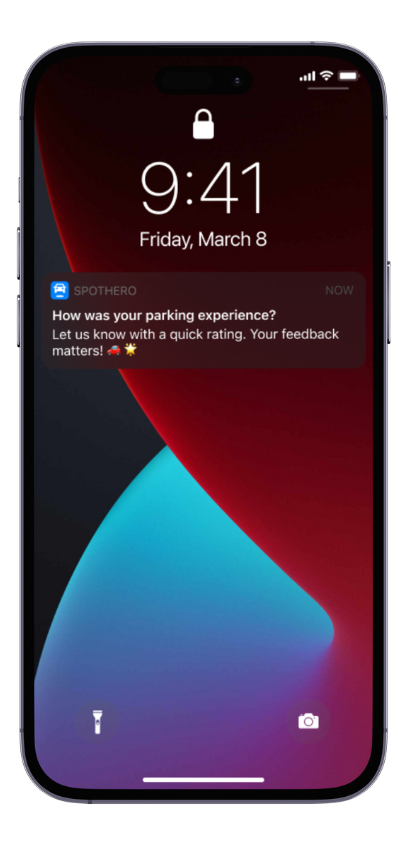
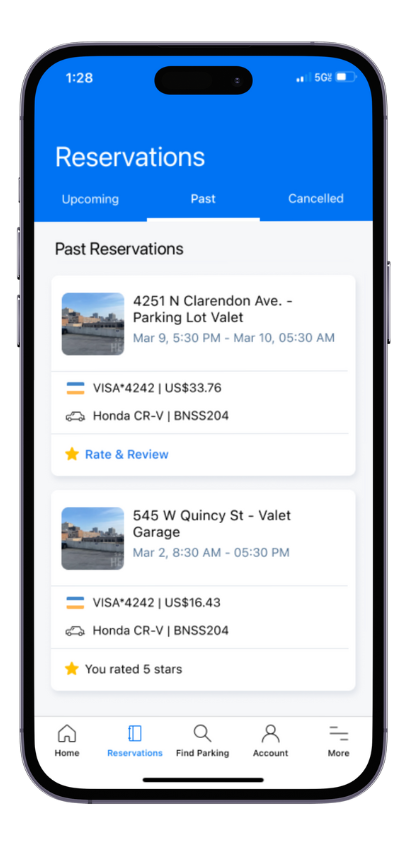
Adding more entry points to the ratings experience and allowing users to rate on web added immediate and drastic increases in the amount of feedback users were providing.
As the engineers were building the MVP / Quick wins, I was designing and testing concepts for the ideal state.
Design, test and validate an ideal state for the ratings & reviews experience, leveraging user-provided input through comprehensive research and testing.
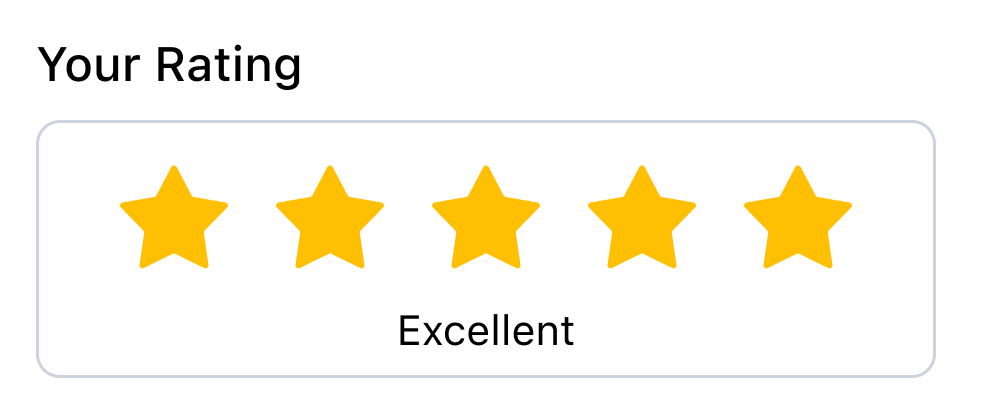
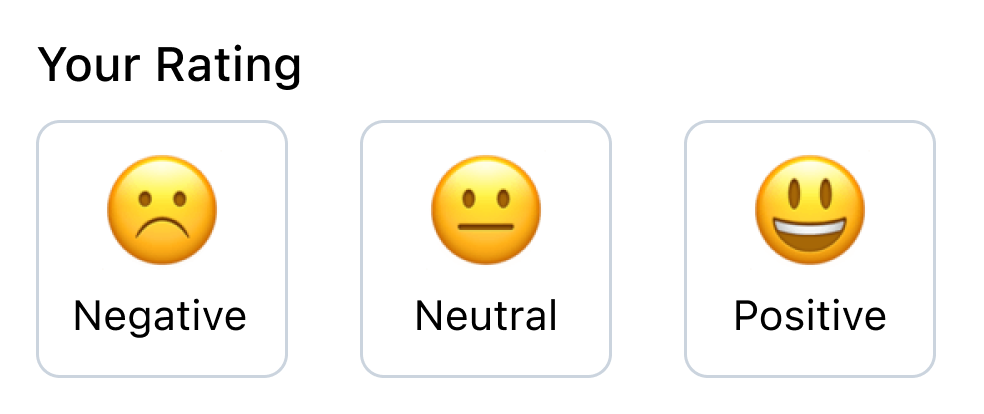
In competitive analysis, I saw that several different digital products utilized a smiley-face emotions-based rating scale instead of a star rating scale. In addition to the competitive analysis, this concept was suggested frequently in meetings with other designers, product managers, and the data science team. Because it was becoming a topic of debate internally, I knew it was worth testing wth a group of users.
Using Maze, I put out a quick concept validation test to 30 people from Maze's participant panel. After giving context and showing full screens of both concepts, I asked users which they prefer. I was surprised at the results– the star concept (concept A) won by a huge landslide. I shared the findings internally and went forward with stars for the final design.


Now that I had the customer data to inform the pre-filled prompts and validated a concept to move forward with, it was time to deign prototypes of the next iteration.
My goal was to have a minimalist design to keep up with design trends, and to add emojis to associate with each prompt, for quicker comprehension and a touch of modernity and delight.
Using Maze, I conducted an unmoderated usability test using a Figma prototype of the new iteration of ratings & reviews. I sent the test to 30 people using Maze's panel. I gave 2 scenarios: a positive experience, and a negative experience, and asked the users to demonstrate how they would go about leaving a rating.
Fortunately, usability testing didn't indicate any problems with the design. Overall, the ease of use score turned out to be 4.8 out of 5.
When asked if the experience looked familiar to users, around 77 percent said that it did. In a free-form text question, I asked users who answered "yes" to provide the other company whose experience that it resembled. To our delight, the ones from which we gathered inspiration were among the most frequent answers.
Because there are so many options for emojis, and different people can interpret them in different ways, I wanted feedback– and there's strength in numbers.
Using SurveyMonkey, I put out a survey to 60 participants, asking them to vote for which emoji resonated most with them for each prompt.
The designs were polished and handed off for development in late April 2024, and went live on all platforms by early June 2024.
The impact of our solution has far surpassed our expectations. Because capturing qualitative data is so much quicker and easier with the pre-filled prompts, we have seen a tremendous increase in qualitative feedback accompanying star ratings. Our goal (OKR) was 10% of all ratings including qualitative feedback. As of August 2024, the amount of ratings that include qualitative feedback is 29%, exceeding our OKR by 190%. This number includes both kinds of qualitative feedback: users who chose pre-filled prompts, users who typed written comments in the comments field, or users who did both. With this massive increase in qualitative feedback, we are able to glean insights to recommend actionable steps our operators can take to improve our users' parking experience at their facility.